
METHODOLOGICAL UPDATE PORTFOLIO PERFORMANCE
To provide a portfolio performance view that is neutral to asset availability, we introduced methodological updates at the start of 2026. Firstly, it applies a data-quality filter to exclude days where an asset was not operational for more than four hours. As a result, revenues from wholesale, aFRR, and FCR on these partial-availability days are removed, which can lead to slightly lower total revenues. However, the same filtering is also applied to the calculation of average marketable power (MW) and energy (MWh), meaning that averages are computed only on fully operational days. This creates a more representative performance metric.
Secondly, duration clustering has been refined. The 2h segment is now defined as 1.51-2.5h rather than extending to 3.5h. This change was requested by asset owners and market participants to create a cleaner benchmark that more closely represents a true 2h asset. The cluster description now also focuses on P10/P90 ranges rather than minimum/maximum values, reducing the influence of outliers.
However, when adjusting for these composition effects, the underlying performance remained nearly identical, confirming that the new methodology improves consistency and robustness rather than materially changing economic outcomes.

Market evolution and BESS revenues October 2026
October extended the rise in German power prices for a third consecutive month, but day-ahead spreads narrowed. The average day-ahead price rose 17% to EUR 169.3/MWh, driven by higher gas prices (TTF +13% to EUR 86.66/MWh amid continued Strait of Hormuz supply risk and low EU gas storage) and a 42% drop in solar output that filled the midday trough: the 12:00-15:00 window rose 145% to EUR 116/MWh, and negative quarter-hours fell from 143 to 7. Because the price floor rose far more than the peaks moved (average daily minimum from EUR 37 to EUR 97.5/MWh, maximum from EUR 287 to EUR 270/MWh), the one-cycle day-ahead top-bottom spread (DA TB) narrowed 31% for both the 1h and 2h benchmarks. Balancing capacity prices also fell (aFRR up -16%, aFRR down -55%, FCR -29%), while the mean aFRR energy price rose 12%.
Portfolio revenues fell accordingly: the 1h portfolio generated EUR 125k/MW/year (-34%) and the 2h portfolio EUR 167k/MW/year (-35%). The decline was driven by aFRR capacity revenue (-63% and -57%), partly offset by higher FCR revenue (+32% and +40%) as larger FCR allocations became optimal more often. Energy arbitrage held up better than the DA TB benchmark (-12% for 1h and -23% for 2h, against -31%), helped by intraday trading and expensive aFRR energy. Year-on -year, revenues were 25% (1h) and 36% (2h) below October 2025, as aFRR capacity prices remain far below last year's levels despite a doubling of day-ahead prices; seasonality and BESS cannibalization likely both play a role.

1. Key month-on-month market indicators
| Indicator | Unit | Sep 2026 | Oct 2026 | MoM |
| Day-ahead auction (avg) | EUR/MWh | 144.82 | 169.27 | +17% |
| Intraday continuous VWAP (avg) | EUR/MWh | 145.53 | 172.57 | +19% |
| Negative DA quarter-hours | Count/share | 143/5% | 7/<1% | -95% |
| FCR capacity (avg) | EUR/MW/h | 22.53 | 16.07 | -29% |
| aFRR capacity up (avg) | EUR/MW/h | 12.17 | 10.19 | -16% |
| aFRR capacity down (avg) | EUR/MW/h | 15.86 | 7.14 | -55% |
| aFRR energy mean (avg) | EUR/MW/h | 140.53 | 157.53 | +12% |
| Imbalance price (avg) | EUR/MWh | 149.40 | 173.49 | +16% |
| TIF gas front month (avg) | EUR/MWh | 76.48 | 86.66 | +13% |
| EUA (avg) | EUR/tCO2 | 85.04 | 86.24 | +1% |
| DA TB 1h / 1 cycle | EUR/MW/day | 236.77 | 163.28 | -31% |
| DA TB 2h / 1 cycle | EUR/MW/day | 439.00 | 304.53 | -31% |
| Solar generation (avg) | GW | 11.90 | 6.87 | -42% |
| Wind generation onshore + offshore (avg) | GW | 16.00 | 19,44 | +22% |
2. Key month-on-month portfolio indicators
| Indicator | Unit | Sep 2026 | Oct 2026 | MoM |
| 1h BESS / 0.9–1.5h: total portfolio PnL | EUR/MW/yr | 190,003 | 124,882 | -34% |
| 1h BESS / 0.9–1.5h: FCR | EUR/MW/yr | 25,409 | 33,642 | +32% |
| 1h BESS / 0.9–1.5h: aFRR capacity | EUR/MW/yr | 105,928 | 39,747 | -63% |
| 1h BESS / 0.9–1.5h: energy arbitrage | EUR/MW/yr | 58,666 | 51,494 | -12% |
| 1h BESS / 0.9–1.5h: average cycling | FCE/day | 1.208 | 1.131 | -6% |
| 1h BESS / 0.9–1.5h: average duration | h/day | 1.340 | 1.327 | +2% |
| 2h BESS / 1.51–2.5h: total portfolio PnL | EUR/MW/yr | 257,223 | 166,635 | -35% |
| 2h BESS / 1.51–2.5h: FCR | EUR/MW/yr | 14,205 | 19,899 | +40% |
| 2h BESS / 1.51–2.5h: aFRR capacity | EUR/MW/yr | 120,820 | 52,045 | -57% |
| 2h BESS / 1.51–2.5h: energy arbitrage | EUR/MW/yr | 122,198 | 94,691 | -23% |
| 2h BESS / 1.51–2.5h: average cycling | FCE/day | 1.519 | 1.389 | -9% |
| 2h BESS / 1.51–2.5h: average duration | h/day | 2.106 | 2.084 | -1% |
3. Portfolio performance October 2026
October results show lower revenues in both portfolios. In both, the decline came mainly from aFRR capacity, partly offset by higher FCR revenue, while energy arbitrage fell by less than the DA TB benchmark. Across assets, the annualized range per marketable MW was EUR 110k-130k in the 1h portfolio and EUR 150k-179k in the 2h portfolio. Both portfolios cycled slightly less.
Year-on-year, total portfolio revenue in October 2026 was 25% lower for the 1h portfolio and 36% lower for the 2h portfolio than in October 2025 (EUR 167k and EUR 258k/MW/year, respectively). Despite a 101% higher day-ahead price, a 27% wider 1h DA TB, and average FCR prices remaining at the same level (+3%), aFRR up capacity prices are still 67% and aFRR down-capacity prices 57% below October 2025 levels. Both seasonality and BESS cannibalization likely play a role in this trend, although data availability is insufficient to reach a conclusion at this point.
4. 1-hour BESS portfolio October 2026
The 1h portfolio generated annualized revenue of EUR 125k/MW in October, a 34% decrease from September (EUR -65k/MW/year). aFRR capacity revenue fell by EUR 66k/MW/year (-63%) and energy arbitrage by EUR 7k/MW/year (-12%), while FCR revenue rose by EUR 8k/MW/year (+32%). Average cycling decreased from 1.21 to 1.13 FCE/day (-6%).
The aFRR capacity decline follows prices: up-capacity prices fell 16% and down-capacity prices 55%, with the sharpest down-capacity declines in the solar blocks (08:00-12:00 -61%, 12:00-16:00 -57%, 16:00-20:00 -67%), and the 20:00-24:00 up-capacity block fell 49%. FCR revenue rose even though FCR capacity prices fell 29%, as allocating a higher share of capacity to FCR became the optimal strategy more often. Energy arbitrage fell by far less than the 1h TB (-12% against -31%), consistent with additional value from intraday trading and aFRR energy, whose mean price rose 12% and whose share of quarter-hours above EUR 200/MWh rose from 19% to 29%. Energy-arbitrage revenue per unit of cycling decreased by about 6%.
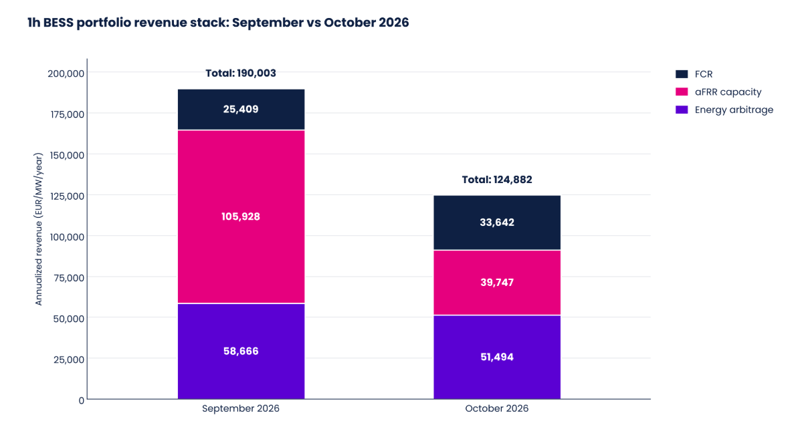 Figure 1. Annualized 1h portfolio revenue stack
5. 2-hour BESS portfolio October 2026
The 2h portfolio generated annualized revenue of EUR 167k/MW in October, down 35% from September (EUR -91k/MW/year). The decrease came from aFRR capacity revenue, which fell by EUR 69k/MW/year (-57%), and from energy arbitrage, which fell by EUR 28k/MW/year (-23%). FCR revenue rose by EUR 6k/MW/year (+40%).
Energy arbitrage again outperformed the benchmark: the 2h DA TB narrowed 31%, while energy arbitrage revenue fell 23%. aFRR capacity revenue fell with prices, which declined in both directions (up -16%, down -55%), whereas in September broadly stable revenue had coincided with mixed prices (up +65%, down -16%).
Average cycling decreased from 1.52 to 1.39 FCE/day (-9%), and energy arbitrage revenue per unit of cycling fell by about 15%, from about EUR 80k to EUR 68k per FCE. The decline per cycle is about half the fall in the 2h DA TB, consistent with intraday trading and aFRR energy partly offsetting the narrower day-ahead spreads: the mean aFRR energy price rose 12%, and the share of quarter-hours above EUR 200/MWh rose from 19% to 29%.
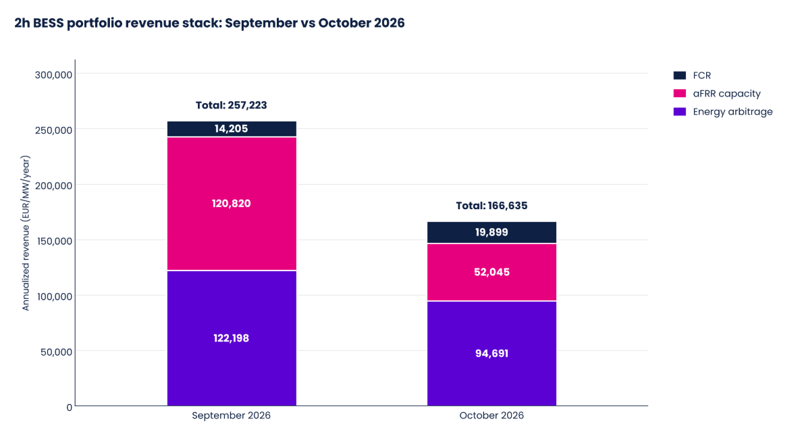 Figure 2. Annualized 2h portfolio revenue stack
6. Wholesale markets
German wholesale prices rose again in October, but unevenly. The average day-ahead auction price increased from EUR 144.82/MWh to EUR 169.27/MWh (+17%), while intraday continuous VWAP rose from EUR 145.53/MWh to EUR 172.57/MWh (+19%). The day-ahead maximum was EUR 574.3/MWh, against EUR 740.0/MWh in September, but 1,051 quarter-hours (35%) cleared above EUR 200/MWh, against 645 (22%).
The DA TB benchmarks narrowed: the 1h / one-cycle spread from EUR 236.77 to EUR 163.28/MW/day (-31%) and the 2h benchmark from EUR 439.00 to EUR 304.53/MW/day (-31%). No day exceeded EUR 450/MW/day on the 1h TB, against three in September; only two days exceeded EUR 250/MW/day, 29 October (about EUR 330/MW/day, the highest of the month) and 6 October (about EUR 269/MW/day). The narrowing was broad-based: the median daily 1h TB fell from about EUR 217 to EUR 154/MW/day (-29%). On average, the daily maximum eased by EUR 17/MWh (to EUR 270/MWh), while the daily minimum rose by EUR 61/MWh (to EUR 97.5/MWh). The narrower spread therefore came from a higher price floor rather than from lower peaks.
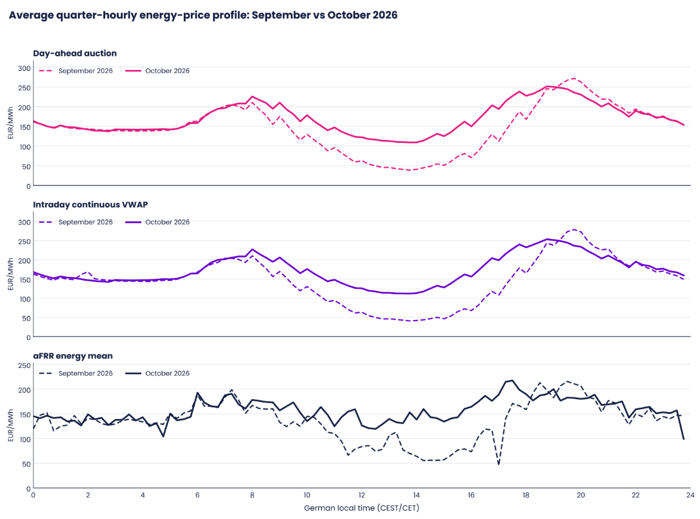 Figure 3. Average quarter-hourly energy price profiles for Sep and Oct 2026 (CEST until 25 Oct, CET thereafter)
The intraday shape shows that October’s repricing was concentrated in the solar trough. The average day-ahead price rose about 145% in the 12:00-15:00 window (EUR 47 to 116/MWh) and about 5% in the 06:00-09:00 window (EUR 188 to 198/MWh), while the 18:00-21:00 window was about 1% lower (EUR 235 to 233/MWh) and the night hours were broadly unchanged. The average of the eight cheapest quarter-hours each day rose from EUR 42 to EUR 103/MWh, and the average 2h spread dropped from about EUR 220 to EUR 152/MWh. Intraday continuous followed the same pattern, with the midday window up about 148% and the evening window unchanged. aFRR energy rose about 78% in the midday window (EUR 76 to 136/MWh) and 3% in the morning, and fell about 4% in the evening.
Solar and wind set the shape of the month. Solar output fell to 6.9 GW on average (-42%), which removed most of the midday surplus and lifted the price floor: the 12:00-15:00 window averaged EUR 116/MWh and only 7 quarter-hours cleared below zero (September: 143). Wind averaged 19.4 GW over the month, about 22% above the 16.0 GW published for September, but with extreme variability: nine days averaged above 25 GW (8-11 and 22-26 October) and six days below 5 GW (2-4 and 29-31 October). Within four days, from Sunday 25 October to Thursday 29 October, daily average wind fell by about 40 GW and the daily day-ahead average rose by about EUR 300/MWh.
6.1 Cross-border flows and market coupling
Over the month, Germany was a net exporter of 0.77 TWh, down from 0.89 TWh in September. Poland (0.83 TWh) and Austria (0.73 TWh) took most of the net exports, while net imports came mainly from France (0.62 TWh) and Norway (0.38 TWh). Full price convergence with the six Core neighbours became even less frequent (7% of quarter-hours vs September’s 10% and August’s 37%). For BESS, as in September, interconnection did not flatten German scarcity prices on low-wind evenings, which kept the top of the spread local.
7. Ancillary services and balancing markets
Average FCR capacity prices fell 29% to EUR 16.07/MW/h, with declines in most blocks of the day (Figure 4): 08:00-12:00 -36%, 12:00-16:00 -41%, 16:00-20:00 -25% and 20:00-24:00 -27%, while the 04:00-08:00 block rose 10% and the 00:00-04:00 block 23%. Portfolio FCR revenues nevertheless increased by 32% for the 1h portfolio and 40% for the 2h portfolio, as allocating a higher share of capacity to FCR became the optimal strategy more often.
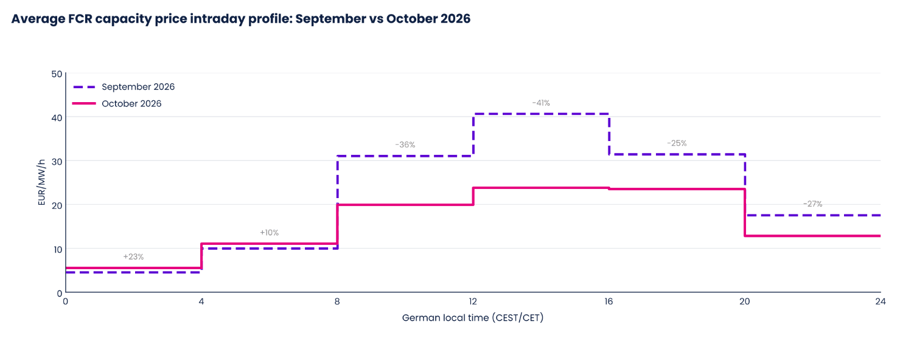 Figure 4. Average FCR capacity price intraday profile for Sep and Oct 2026.
aFRR capacity prices fell in both directions. Average up capacity prices fell 16% to EUR 10.19/MW/h, and down-capacity prices fell 55% to EUR 7.14/MW/h, while the mean aFRR energy price increased 12% to EUR 157.53/MWh. Down-capacity declines were concentrated in the solar blocks (08:00-12:00 -61%, 12:00-16:00 -57%, 16:00-20:00 -67%), alongside a 42% lower solar output. The median aFRR energy price increased from about EUR 144.7/MWh to EUR 161.7/MWh, and the share of quarter-hours above EUR 200/MWh rose from 19% to 29%.
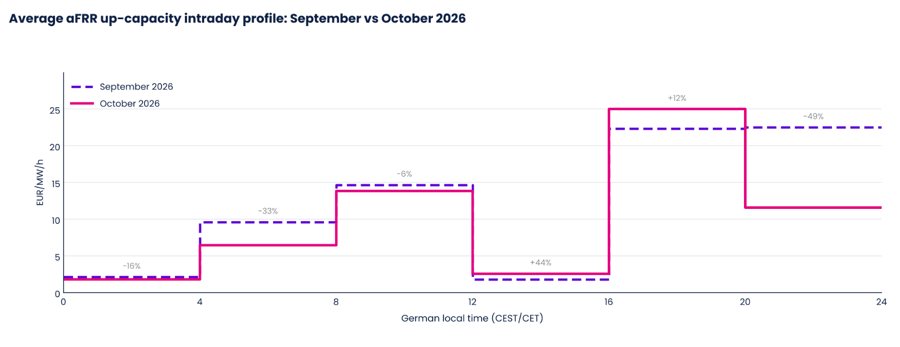 Figure 5. Average aFRR up capacity intraday profile for Sep and Oct 2026.
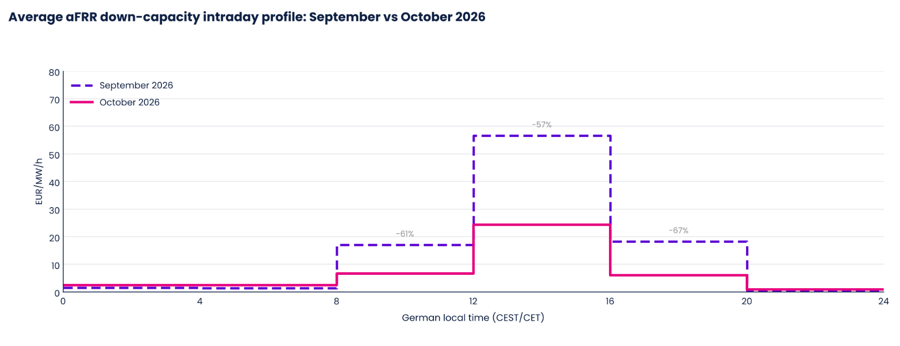 Figure 6. Average aFRR down capacity intraday profile for Sep and Oct 2026.
The profiles show up-reserve value concentrating in the late afternoon, while down-reserve value in the solar hours collapsed. Daily up-capacity averages peaked at about EUR 22.7/MW/h on 6 October, against EUR 35-37/MW/h on 22-23 September. Down capacity (Figure 6) fell most in absolute terms in the midday block, from EUR 56.57 to EUR 24.35/MW/h, and even the highest daily average of October (EUR 12.8/MW/h on 10 October) was close to the lowest daily average of September (EUR 12.2/MW/h).
Imbalance prices rose with the energy market but with fewer extremes. The average imbalance price rose 16% to EUR 173.5/MWh, and the 18:00-21:00 average was EUR 227/MWh (September: EUR 267/MWh). The gap between imbalance and day-ahead prices averaged only about EUR 4/MWh below September. The standard deviation of quarter-hourly imbalance prices was about 28% lower than in September. Only 2 quarter-hours exceeded EUR 1,000/MWh (against 15 in September) and 1 fell below EUR -500/MWh.
8. Fundamentals
The fundamental mix moved further away from solar, with higher demand and more wind. Average solar generation fell from 11.9 GW to 6.9 GW (-42%), load increased from 51.1 GW to 53.7 GW (+5%), and wind rose from 16.0 GW to 19.4 GW (+22%). The solar decline is seasonal rather than weather-driven: the Deutscher Wetterdienst reports 121.7 sunshine hours for October, 13% above the 1991-2020 average but about 37% below September’s roughly 192 hours, in line with the fall in solar output. Sunshine was unevenly spread, well above average in the west and south, and below average in the north. Residual load (load minus wind and solar) averaged 27.4 GW, up 18% from 23.2 GW. Gas-fired generation rose 44% month-on-month, with the midday average increasing from 2.5 GW to 5.2 GW (Figure 7).
Higher average wind masked extreme variability. Daily average wind ranged from 2.4 GW (4 October) to 46.5 GW (24 October). Negative prices were rare and wind-driven: the seven negative quarter-hours (all at EUR -0.01/MWh, on Saturday 10 and Sunday 25 October) averaged 40.0 GW of wind, and three of them came before sunrise with no solar at all, whereas September’s negative weekend prices came from a combined solar and wind surplus.
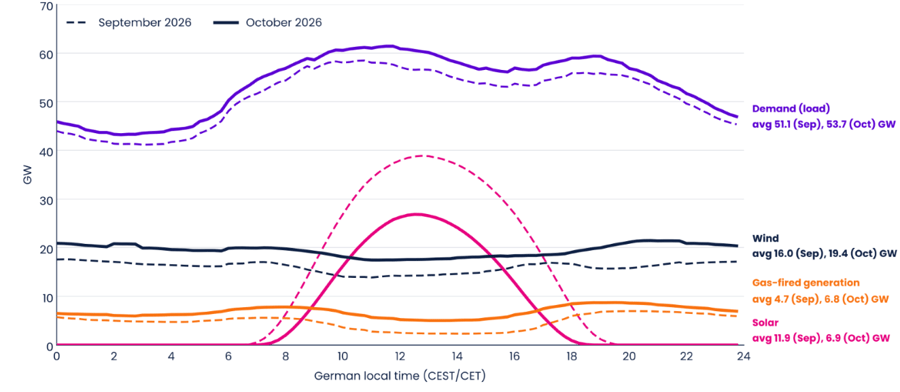 Figure 7. Average intraday profile for Sep and Oct 2026, including demand, wind, solar, and gas-fired generation.
At October fuel and carbon prices, the short-run cost of gas-fired generation was roughly EUR 210-280/MWh, in line with the average of the eight most expensive quarter-hours each day (EUR 255.5/MWh), while the peaks of up to EUR 574/MWh reflect scarcity pricing above fuel costs. Nevertheless, thermal input costs rose further compared to September. TTF front-month futures averaged EUR 86.66/MWh in October, up 13% from EUR 76.48/MWh in September.
Liquefied natural gas traffic through the Strait of Hormuz hit its highest levels since the war began, but the gap to a normal supply still exists and is priced in addition to the winter risk and the lack of visibility of a negotiated solution. In addition, EU gas storage ended October at roughly 75%, 15 percentage points below the five-year average of 90% and 2 points below the lowest level of the past five years (77%), with Germany at 59%. Carbon added a smaller but supportive layer. EUA futures averaged EUR 86.24/t in October, up 1% from EUR 85.04/t in September. Higher gas and carbon costs lifted the cost floor of thermal generation, which is consistent with the higher daily minimum prices in October.
9. Historic evolution of ancillary service prices and spreads
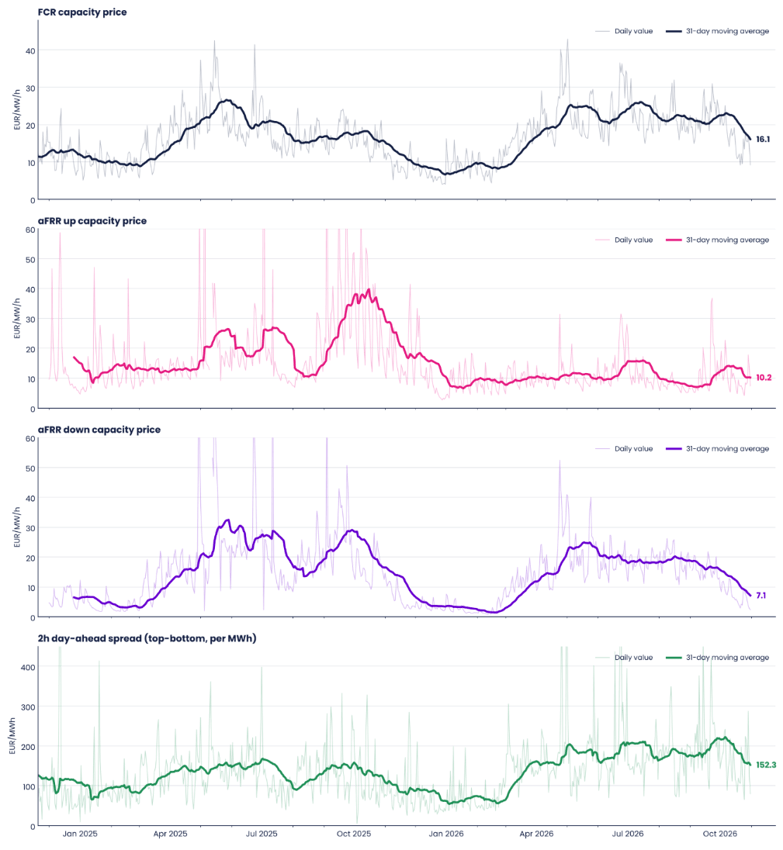 Figure 8. Evolution of FCR prices and 2h day-ahead spread (average daily values and 31-day moving average).